Maps
Interactive
Animated |
|
Animated Maps
Definition - Just as an animated cartoon is a cartoon that moves, an animated map is a map that moves. Cartographic Animation is any moving presentation that shows spatial change by rapidly displaying a series of frames.
Why? - Cartographic Animation describes something that would not be evident if the map were viewed individually, such as trends and processes
|
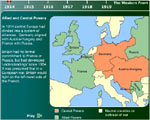
Western Front |
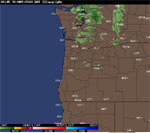
Moving Radar |
Types:
- Presentation - Allows the viewer little or no control over the progress of the product; the animation is only viewed.
- Interative - Offer the viewer considerably more control over the course of the animation.
|
Animation Variables:
- Size - the size of an area on a map may be changed to show changes in value
- Shape - An area on a map can be made to change shape
- Position - A dot moved across the map to show a change in location
- Speed - The speed of movement varies to accentuate the rate of change
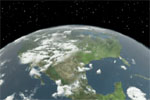
- Viewpoint - A change in the angle of view, could be used to accentuate a particular part of the map as part of an animation
- Distance - A change in the proximity of the view to the scene, as in the case of perspective view (Map scale)
- Scene - The use of visual effects such as fade, mix, and wipe to indicate a transition in an animation from one subject to another
- Texture, Pattern, Shading, Color - To change a variable being displayed
|
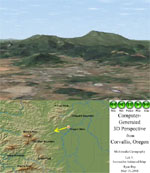
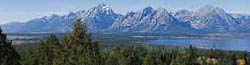
Spinning Corvallis |
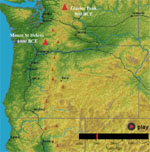
Volcanic Eruptions |
Types of Animation:
- Frame Based
- Simplest Form
- Series of individual full frames
- Illusion of movement by changing frames quickly
- Examples are flip books and slide shows
- Cast Based
- Based on cels (individual layer of a frame animation)
- Uses tweening to create motion between keyframes
- Position
- Orientation
- Color
- Intensity
- Camera focal length
|
Classification:
- Temporal - Depicts sequences of change over time
- Non-Temporal - Depicts change over space or attribute, not time
|
ESRI Article |
|
| << back |
Page 2: Animated Maps |
next >> |
|